![GSI_A7[1]-1-1](https://www.getgsi.com/hs-fs/hubfs/GSI_A7%5B1%5D-1-1.png?width=125&height=56&name=GSI_A7%5B1%5D-1-1.png)
See What Matters
- Most NetSuite health checks fail because they produce undifferentiated finding lists with no business context, turning reports into shelf-ware. A rigorous assessment must map every finding to operational impact.
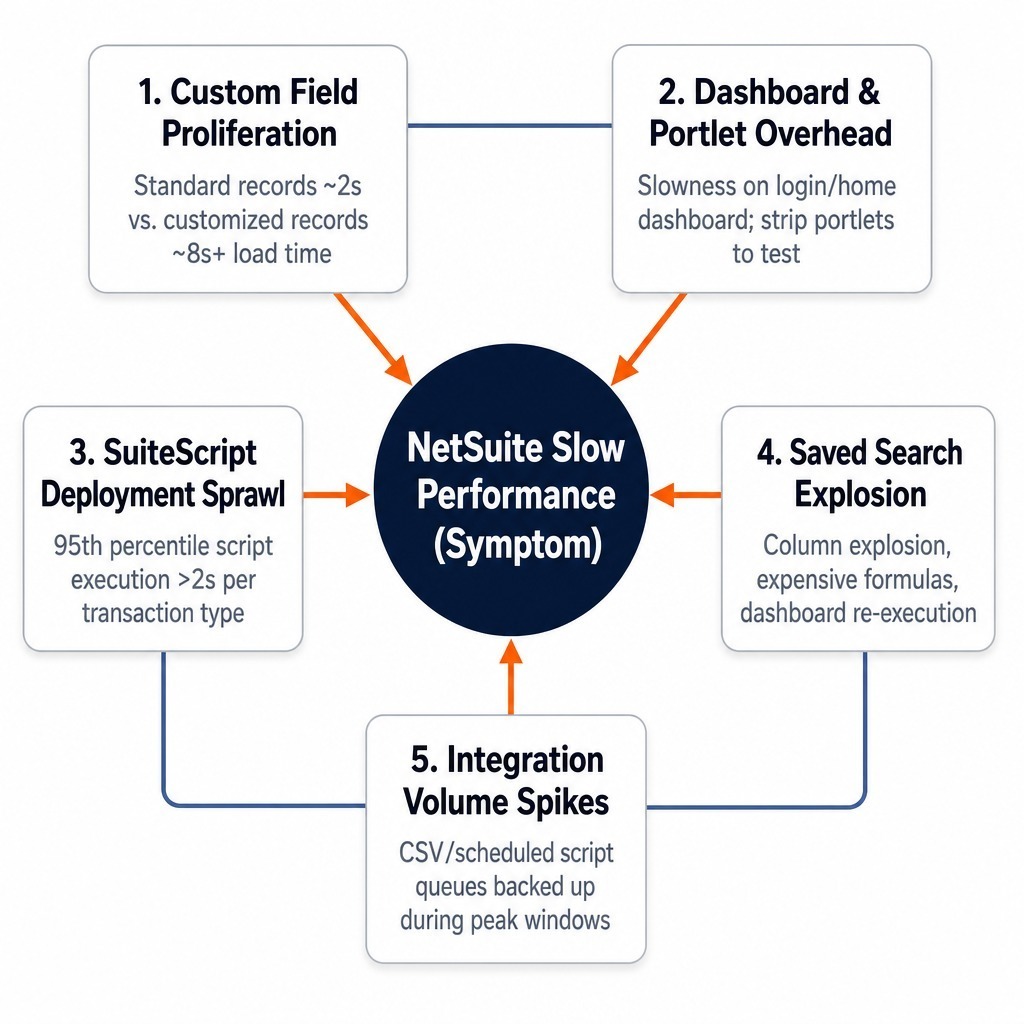
- NetSuite's slow performance is rarely the platform's fault. It typically traces back to five root causes: custom field proliferation, dashboard overhead, SuiteScript deployment sprawl, poorly constructed saved searches, and integration volume spikes.
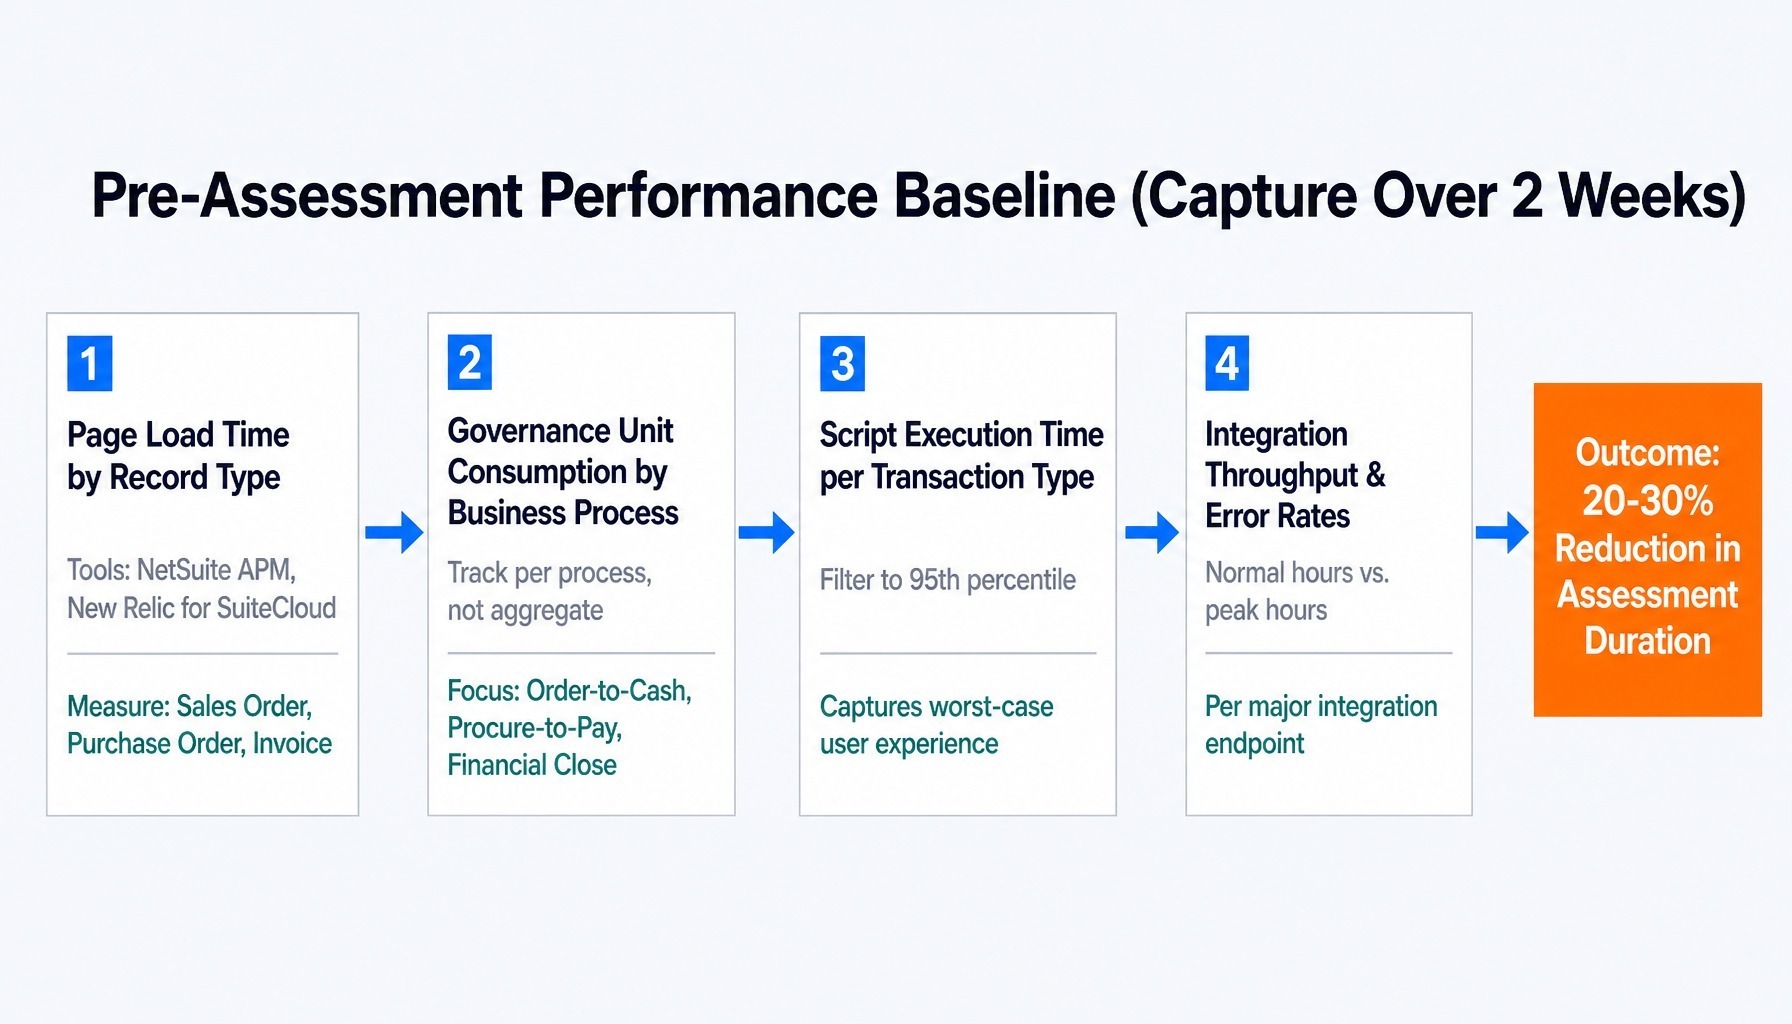
- Before engaging any external assessor, build an internal performance baseline by tracking page load times, governance unit consumption by business process, script execution times, and integration throughput. This cuts assessment time by 20-30%.
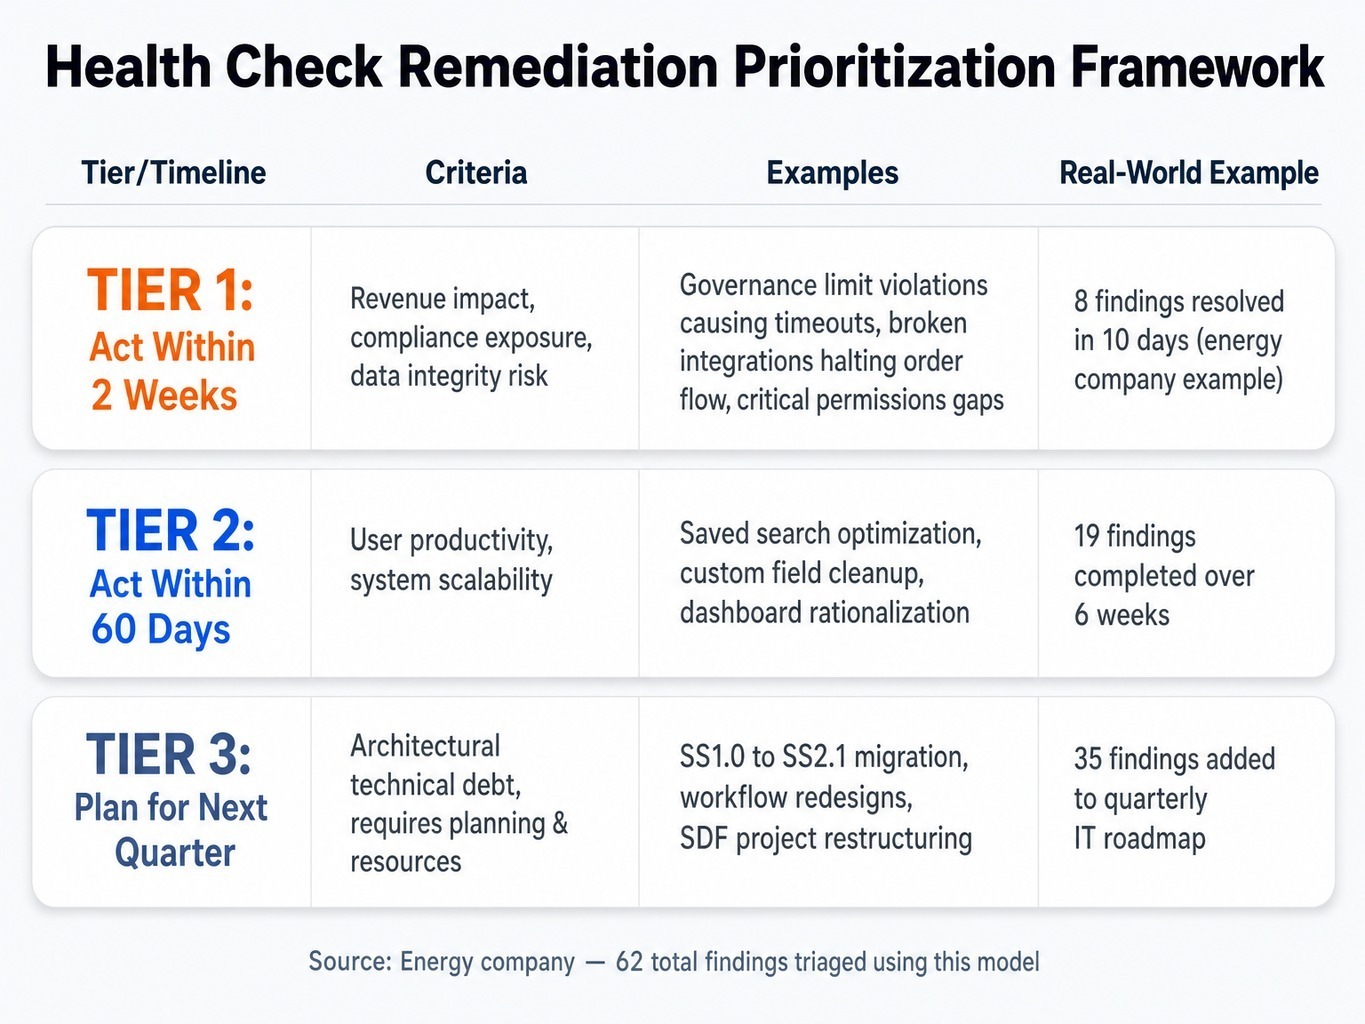
- Prioritize remediation findings using a three-tier model: Tier 1 (Act within 2 weeks) for issues hitting revenue or compliance; Tier 2 (60 days) for user productivity; Tier 3 (Next quarter) for architectural technical debt.
- The value of a health check is not the number of findings, but whether your organization can act on the most critical ones within 30 days.
A mid-market distribution company commissions a NetSuite health check. The consulting partner returns a 40-page PDF cataloging 87 findings, neatly categorized as high, medium, or low. The steering committee meets. Debates ensue. Six months later, the team has acted on exactly three of them—all cosmetic. The report gathers dust in a shared drive.
If this scenario feels familiar, you understand the core problem with most NetSuite assessments. It's not that they fail to find issues; it's that they produce undifferentiated lists with no diagnostic depth, no prioritization logic, and no connection to business impact.
The report becomes shelf-ware. The performance issues persist.
This guide is for leaders who need to turn assessment findings into operational improvements. We will cover what a rigorous NetSuite health check actually evaluates, the root causes of slow performance that most assessments misdiagnose, how to build an internal baseline before engaging an assessor, and how to prioritize remediation so your next assessment drives action, not just another report.
What a NetSuite Health Check Actually Evaluates—and What Most Assessments Skip
A NetSuite health check is a structured technical and functional audit of your instance's configuration, customizations, integrations, security posture, and performance characteristics, measured against operational best practices and your specific business processes.
Most assessments cover the visible surface of system health adequately. They review your chart of accounts, find unused custom fields, and check API logs. But they often skip the diagnostic layers that reveal compounding problems—the ones that actually cause intermittent timeouts and grind your finances close to a halt.
Consider a distribution company whose health check flagged 14 'medium-severity' saved search issues. The report completely missed that a single afterSubmit script chain was consuming 40% of their governance budget on every sales order, causing timeouts during peak hours. The team spent weeks "fixing" searches while the real issue, hidden in the script execution log, went untouched.
A health check's value is determined not by the quantity of its findings, but by whether it examines the layers where this kind of technical debt actually lives. This requires going beyond surface configuration and using tools like NetSuite APM, Strongpoint by Netwrix for change tracking, and disciplined SuiteCloud Development Framework (SDF) project hygiene to see the complete picture.
The Standard Domains: Configuration, Roles, and Integration Connectivity
Every competent NetSuite assessment will cover three foundational domains. These are necessary but insufficient for a deep diagnosis.
- Application Configuration & Data Architecture: A review of custom fields, record types, saved searches, and dashboards. This identifies data model inefficiencies and custom record bloat.
- Roles & Permissions: An audit of role-based access control, segregation of duties, and user provisioning against the principle of least privilege. This reduces audit exposure and mitigates the performance cost of record-level access control overhead.
- Integration Health: An analysis of API usage patterns, connector reliability from middleware like Celigo integrator.io, and data synchronization integrity.
These domains represent the table stakes of a NetSuite assessment. They find obvious problems but rarely uncover the root cause of systemic slow performance.
Read more: Updating Custom Record Permissions in NetSuite
The Diagnostic Layers Most Assessments Miss
A rigorous assessment goes deeper, focusing on three areas where performance and stability issues compound silently.
- Governance Unit Budgeting Per Business Process: This moves beyond aggregate monitoring to understand which specific transaction types (e.g., order-to-cash, procure-to-pay) consume the most governance units and why. It's the key to diagnosing concurrency throttling.
- SuiteScript Deployment Sprawl & Execution Chain Analysis: Mature instances suffer from dozens of overlapping scripts. A deep assessment maps afterSubmit chain depth, identifies client scripts that cause render blocking, and audits SS2.1 async refactors that may have introduced hidden performance debt.
- Sandbox-to-Production Configuration Drift: Using SDF project hygiene, an assessor can detect when sandbox environments no longer reflect production reality. Without this, regression testing is unreliable and can provide a false sense of security before a go-live.
If your last assessment didn't analyze these layers, it likely missed the most significant opportunities for improvement.
Five Root Causes of NetSuite Slow Performance Most Teams Misdiagnose
The complaint "NetSuite is slow" is a symptom, not a diagnosis. While platform-wide incidents can occur, persistent NetSuite performance issues almost always trace back to specific configuration and customization decisions. Most teams misattribute this slowness to the platform itself, when the cause is often within their control.
The two most common culprits are custom field proliferation and dashboard overhead.
- Custom Field Proliferation: Every custom field on a transaction record adds to the record load waterfall. A manufacturing company with 200+ custom fields on their sales order form is paying a rendering tax on every single page load, which is compounded by sublist rendering penalties. Diagnostic Clue: If page load times vary dramatically between standard records (2 seconds) and heavily customized ones (8+ seconds), custom field count is the first place to look.
- Dashboard & Portlet Overhead: Role-based dashboards that simultaneously load multiple SuiteAnalytics portlets, KPI scorecards, and reminder widgets create significant page load latency, especially for roles assigned to many users. Diagnostic Clue: If users report slowness primarily on login or when navigating to the home dashboard, temporarily strip all portlets from a test role and measure the performance difference.
Beyond these, three more insidious causes often require deeper analysis.
SuiteScript Deployment Sprawl and Execution Chain Depth
In mature NetSuite instances, the most damaging performance killer is not a single bad script but the cumulative effect of script deployment sprawl. Dozens of user event, client, and scheduled scripts deployed over years of incremental change often overlap, conflict, or create long execution chains.
The most critical factor is afterSubmit chain depth. When multiple user event scripts fire sequentially on the same record save, each one adds latency. What might have been a 200-millisecond script becomes part of a 3-second chain, frustrating users. The introduction of SS2.1 async patterns has also created a new category of hidden debt, as asynchronous operations can silently queue and compete for resources.
Diagnostic Clue: Use NetSuite's execution log to measure the total script execution time per transaction type. If the 95th percentile exceeds two seconds, that entire script chain needs to be mapped and refactored, often by migrating logic from N/search to the more efficient N/query module.
Saved Search Explosion and Formula Field Cost
Does having too many saved searches cause NetSuite slow performance? The answer is nuanced. The issue is not the quantity of saved searches but their construction. The real problems are:
- Search Column Explosion: Searches with an excessive number of result columns that force the database to join multiple tables.
- Expensive Formula Fields: Complex formulas that cannot be resolved at the database level and force NetSuite to perform row-by-row evaluation.
- Dashboard Data Sources: Searches used in dashboard portlets that re-execute on every single page load.
A diagnostic layer most health checks skip entirely is analyzing SuiteQL execution plans. This can reveal which searches are performing inefficient full table scans versus indexed lookups, pinpointing the exact cause of a slow search.
Integration Volume Spikes and Concurrency Throttling
High-volume integrations, particularly from middleware like Celigo integrator.io or custom REST/SOAP web services, can trigger NetSuite's concurrency throttling. This doesn't just slow down the integration; it degrades performance for all interactive users.
Imagine a retail company's e-commerce platform pushing 5,000 order records via SuiteTalk during a flash sale. This can saturate the available concurrency slots, causing interactive users in accounting or warehouse operations to experience page load failures and timeouts. The system is protecting itself, but the business experiences it as a system-wide failure.
Diagnostic Clue: Monitor your CSV import queue depth and scheduled script queue depth during peak integration windows. If queues are consistently backed up, you are likely hitting concurrency limits and creating resource contention.
Read more: NetSuite Integration Services | GSI: Streamline Your Operations.
How to Build a NetSuite Performance Baseline Before Any Assessment
Engaging an external assessor without an internal performance baseline is like hiring a mechanic without knowing your car's normal idle speed. You cannot distinguish real findings from noise, and you have no way to measure whether remediation actually improved anything.
Before you commission a NetSuite health check, your internal team should capture objective data. This gives the assessor a head start and provides you with a "before" snapshot to evaluate the project's ROI. Organizations that do this typically reduce assessment duration by 20-30% because the partner can skip discovery and move directly to root cause analysis.
Capture these four metrics over a two-week period:
- Average Page Load Time by Record Type: Use NetSuite APM or New Relic for SuiteCloud to measure the load time for your most critical records (e.g., Sales Order, Purchase Order, Invoice).
- Governance Unit Consumption by Business Process: Don't just look at the aggregate. Track consumption for your core processes like order-to-cash, procure-to-pay, and financial close to see where the real governance cost lies.
- Script Execution Time per Transaction Type: Filter execution logs to the 95th percentile to capture the worst-case scenarios your users experience, not just the average.
- Integration Throughput and Error Rates: Measure transaction volume and error rates for each major integration during both normal and peak business hours.
An IT director who captured two weeks of APM data before an assessment enabled the GSI team to immediately identify that 80% of their governance consumption came from just three afterSubmit scripts on purchase orders—a finding that would have otherwise taken days to uncover.
Health Check Anti-Patterns: Why Most NetSuite Assessments Produce Reports Nobody Acts On
The majority of NetSuite health check reports become shelf-ware within 90 days. This isn't because the findings are wrong; it's because the report structure makes it impossible for a cross-functional team to decide what to do first. It's a delivery problem, not a diagnostic one, and it stems from two specific anti-patterns.
A professional services firm received an 87-finding report. After three months of debating priorities in a steering committee, they had only acted on items that individual team members could fix unilaterally. The systemic issues remained untouched. Recognizing these anti-patterns is the key to avoiding this outcome.
Anti-Pattern 1: The Undifferentiated Finding List
The most common failure is the report that lists 50-100 findings categorized only as high, medium, or low severity. This format is useless for executive decision-making.
A CFO receiving this report has no way to determine if fixing a saved search performance issue is more urgent than remediating a role permissions gap. The report treats them as equivalent "medium" items, but one impacts user productivity while the other creates a direct audit exposure.
A rigorous assessment must map every finding to a business process and quantify its operational impact: transaction completion rate degradation, financial close cycle time, audit risk, or user productivity loss. Severity ratings without business context are simply noise.
Anti-Pattern 2: Diagnosis Without Remediation Sequencing
The second failure is the report that identifies problems but provides no guidance on remediation sequencing. It doesn't explain which fixes are prerequisites for others, which can be done in parallel, which require a maintenance window, and which need regression testing in a sandbox first.
A company once attempted to remediate a SuiteScript performance issue and a workflow redesign simultaneously, only to discover the workflow depended on the script's output. The parallel effort created a cascading failure that took days to untangle. A health check that does not deliver a dependency-aware remediation sequence is incomplete. The value of an assessment is measured by whether your team can confidently act on it within 30 days.
How to Prioritize Remediation Findings Without Stalling
To convert a list of findings into an action plan, use a simple three-tier prioritization model. This framework helps you triage issues based on business impact and urgency, ensuring your team focuses on what matters most first.
- Tier 1: Act Within 2 Weeks. These are critical issues that directly degrade transaction completion rates, create audit exposure, or cause data integrity risks. This bucket includes governance limit violations causing timeouts, broken integrations halting order flow, and critical permissions gaps.
- Tier 2: Act Within 60 Days. These findings affect user productivity and system scalability but do not create immediate business risk. This is where you tackle saved search optimization, custom field cleanup, and dashboard rationalization to improve the daily user experience.
- Tier 3: Plan for Next Quarter. This tier is for architectural technical debt that requires careful planning and resources. It includes major projects like SuiteScript refactoring from SS1.0 to SS2.1, significant workflow redesigns, or restructuring your SDF projects.
An energy company used this framework to triage 62 findings from their health check. They identified 8 Tier 1 items that were resolved in 10 days, 19 Tier 2 items completed over the next six weeks, and the remaining 35 Tier 3 items were incorporated into their formal quarterly IT roadmap. The report drove action because it was translated into a plan.
What a GSI NetSuite Health Check Delivers That Most Assessments Don't
The gap between a generic assessment and a rigorous one comes down to diagnostic depth and a commitment to actionable outcomes. Most organizations recognize they lack the internal capacity for deep SuiteScript chain mapping, SuiteQL execution plan analysis, or per-process governance unit budgeting. This is where a specialized managed services partner becomes essential.
At GSI, we resolve this tension through a unique combination of experience, technology, and accountability.
- Deep Practitioner Experience: Our consultants average over 15 years of experience in NetSuite and other enterprise applications. They've conducted hundreds of assessments and have the pattern recognition to know exactly where compounding technical debt hides.
- AI-Powered Application Intelligence: We utilize our proprietary GENIUS AI platform to accelerate diagnostic analysis. It identifies configuration anomalies, script performance patterns, and security risks across the entire instance, allowing our consultants to focus on root cause analysis, not just data gathering.
- A 100% Service Guarantee: Our guarantee is a commitment to accountability. We deliver a dependency-aware remediation roadmap with every finding mapped to business impact—not a generic list. If our assessment does not produce actionable, prioritized findings that your team can execute, we own that failure.
Request a NetSuite Health Check Consultation.
From Findings to Action
The value of a NetSuite health check is not measured by the number of findings it produces, but by whether your organization can act on those findings within 30 days. Most assessments fail at the delivery layer—producing undifferentiated lists with no business-impact mapping or remediation sequencing.
The fix begins before the assessment even starts, with an internal performance baseline that gives your assessor a head start and gives you an objective measurement of improvement. By focusing on root causes, demanding business context for every finding, and using a structured prioritization framework, you can transform a health check from a static report into a dynamic action plan.
The next time someone proposes a NetSuite health check, ask them not what they will evaluate, but how they will ensure the findings get implemented. That question alone will separate the rigorous partners from the report factories.
Frequently Asked Questions
What is the difference between a NetSuite health check and a full system audit?
A health check is a targeted assessment of configuration, performance, and security against best practices, typically done in 1-3 weeks. A full system audit is broader, often including business process re-engineering and strategic roadmapping, and can take 6-12 weeks. Most organizations start with a health check to fix urgent issues before committing to a full audit.
How often should you run a NetSuite performance assessment?
At a minimum, you should conduct one annually. Additionally, plan for an assessment after any major release update, significant customization deployment, or acquisition (especially in OneWorld). Proactive teams run post-release micro-checks after each NetSuite update to catch configuration drift before it degrades performance.
Should I hire a NetSuite partner or run a health check internally?
Internal teams should build performance baselines and monitor ongoing metrics. However, diagnosing root causes—like SuiteScript dependencies, SuiteQL inefficiencies, or cross-module conflicts—typically requires external consultants with pattern recognition across dozens of instances. The best approach combines internal data with external diagnostic expertise.
What tools can monitor NetSuite performance in real time?
NetSuite's built-in Application Performance Management (APM) SuiteApp monitors script execution and page loads. For deeper visibility, New Relic for SuiteCloud adds infrastructure-level observability. Tools like Strongpoint by Netwrix track configuration changes, while Fastpath Assure monitors access controls. You can also use SuiteAnalytics Workbook and SuiteQL to build custom dashboards for governance and search performance.
Why does NetSuite slow down after a new release update?
NetSuite's biannual releases can alter APIs or change how workflows execute, causing older customizations to run inefficiently. The most common issue is SuiteScript compatibility, where scripts using deprecated methods still function but with added overhead. A targeted post-release regression check against your heaviest transaction types helps catch these regressions early.
How do custom records and fields impact NetSuite page load times?
Every custom field adds to the record load waterfall—the sequence of data retrievals needed to render a page. Custom records used in sublists compound this further. The impact is nonlinear: 50 fields may be negligible, but 200+ fields, especially with formula dependencies, can easily double or triple page load times. Audit and archive unused custom fields annually.